Pendulum charts or dowsing charts can be used to
simplify many tasks - they can be used to determine
the depth of the water source, the water quality,
rate of flow, pH, presence of pollutants, etc.,
also they can be used to measure almost any physical
state (temperature, pressure, weight, speed, etc.)
The following are just a few examples:

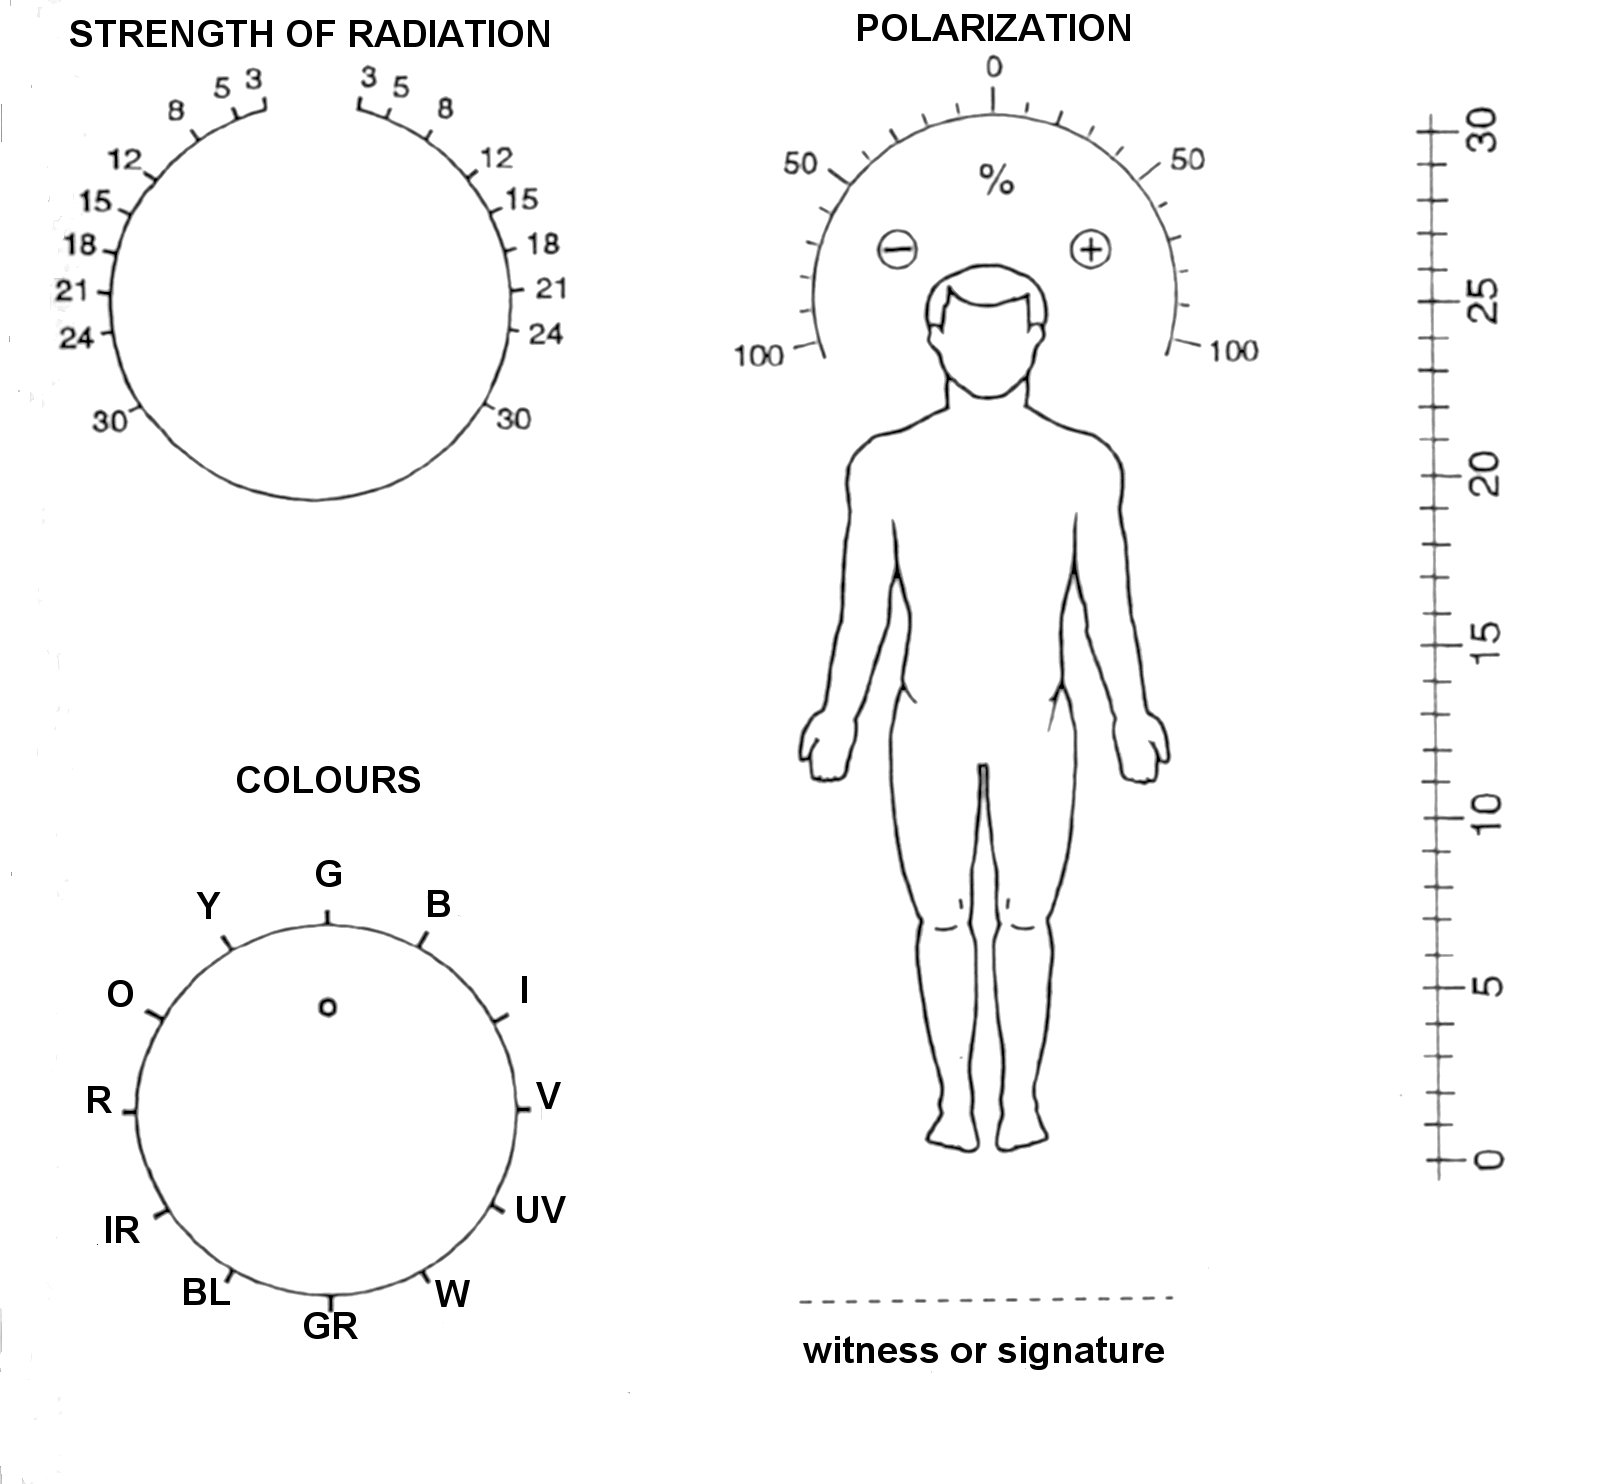
 The
chart above shows a linear version of a biometer
used to determine the "colour" of radiation
(as used in chromotherapy). The printed black
circle on the left acts as the energy gathering
field and should be 30mm diameter (resonant with
the (-) green frequency). The
chart above shows a linear version of a biometer
used to determine the "colour" of radiation
(as used in chromotherapy). The printed black
circle on the left acts as the energy gathering
field and should be 30mm diameter (resonant with
the (-) green frequency).
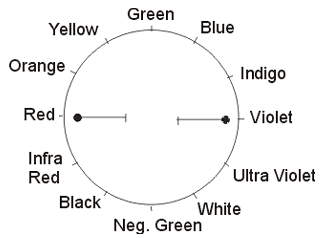
The chart to the left is a circular
version of the colour detector. The two lines
inside act as resonators to allow accurate readings
with different orientations (relative to the North)
- the same way as resonators used in the Universal
Pendulums.
 Lie Detector
When we tell the truth - just one hemisphere is
working - we get oscillation from the front to
the back.
When we tell a lie - both hemispheres are working
and we get oscillation
from left to right.
This can be used from a distance using a simplified
picture of the brain.
Basic Dowsing Chart

Expanded Bovis Scale

Physical

Etheric

Astral

Mental

Causative

Spiritual

Pure Spiritual Being

Grapho-Puncture (JERZY
WOZNIAK)
Source: Leszek Matela - Radiestezja, Zbigniew
Krolicki - Radiestezja Zdrowia, Jerzy Wozniak
- Nowoczesna Radiestezja
In essence - pendulum charts are an easy way to speed up the dowsing procedure and get numerical information that otherwise would be more difficult to obtain.

|